An Introduction to Statistics using SPSS
- Introduction
- Statistics
- Variable
- Measurement
- Measurement Scales
- Descriptive Statistics
- Boxwhisker Diagram
- Scatter Plot
- Regression Analysis
- Simple Linear Regression
- Multiple Linear Regression
- Polynomial Regression Analysis
- Analysis of Variance (ANOVA)
- Analysis of Covariance (ANCOVA)
- Factorial Experiments
Introduction

alt text
Statistics
- Statistics is the science of uncertainty & variability
- Statistics turns data into information
- Data -> Information -> Knowledge -> Wisdom
- Statistics is the interpretation of Science
- Statistics is the Art & Science of learning from data
Variable
- Characteristic that may vary from individual to individual
Measurement
- Process of assigning numbers or labels to objects or states in accordance with logically accepted rules
Measurement Scales
- Nominal Scale: Obersvations may be classified into mutually exclusive & exhaustive categories
- Ordinal Scale: Obersvations may be ranked
- Interval Scale: Difference between obersvations is meaningful
- Ratio Scale: Ratio between obersvations is meaningful & true zero point
Descriptive Statistics
- No of observations
- Measures of Central Tendency
- Measures of Dispersion
- Measures of Skewness
- Measures of Kurtosis
Example
Following data presents a subset of Yarn strength and Elongation percentage from an experiment to test yarn strength and extension of blue jeans designed under Conducted in Sudan Textile Factory Method.
| Single Strength | Elongation |
|---|---|
| 419.7 | 3.22 |
| 442.7 | 2.78 |
| 457.4 | 1.60 |
| 435.2 | 1.88 |
| 404.1 | 1.88 |
| 479.1 | 2.34 |
| 450.8 | 2.44 |
| 432.7 | 2.12 |
| 378.1 | 2.88 |
| 413.3 | 2.37 |
| 365.1 | 1.40 |
| 492.0 | 2.02 |
| 389.5 | 2.02 |
| 467.8 | 1.92 |
| 442.3 | 2.44 |
| 444.3 | 1.74 |
Reference
Mousa, A.H.N. (1978). Analysis of the Effect of Size Formulation Variations on Yarn Tenacity and Elongation. Textile Research Journal, 48, 713-717.

Analyze > Descriptive Statistics > Descriptives …


Boxwhisker Diagram
- Pictorial display of five number summary (Minimum, Q1, Q2, Q3 and Maximum)
Example
Effact of Two drying methods (Line Dry and Tumble Dry) are to be compared for some kind of shrinkage of some particular brand of fabric. Following data was observed from an experiment:
| Drying Method | Length Shrinkage | Drying Method | Length Shrinkage |
|---|---|---|---|
| Line Dry | 1.0 | Tumble Dry | 2.8 |
| Line Dry | 1.5 | Tumble Dry | 3.0 |
| Line Dry | 2.1 | Tumble Dry | 3.0 |
| Line Dry | 2.1 | Tumble Dry | 2.9 |
| Line Dry | 5.4 | Tumble Dry | 6.8 |
| Line Dry | 5.4 | Tumble Dry | 6.5 |
| Line Dry | 2.8 | Tumble Dry | 2.9 |
| Line Dry | 3.0 | Tumble Dry | 3.6 |
| Line Dry | 1.4 | Tumble Dry | 3.5 |
| Line Dry | 1.8 | Tumble Dry | 3.7 |
| Line Dry | 2.3 | Tumble Dry | 3.5 |
| Line Dry | 2.2 | Tumble Dry | 3.5 |
| Line Dry | 7.0 | Tumble Dry | 7.9 |
| Line Dry | 7.2 | Tumble Dry | 8.0 |
| Line Dry | 4.2 | Tumble Dry | 4.0 |
| Line Dry | 4.5 | Tumble Dry | 4.8 |
| Line Dry | 1.8 | Tumble Dry | 4.0 |
| Line Dry | 1.9 | Tumble Dry | 4.2 |
| Line Dry | 2.5 | Tumble Dry | 3.9 |
| Line Dry | 2.2 | Tumble Dry | 3.7 |
| Line Dry | 7.5 | Tumble Dry | 8.6 |
| Line Dry | 7.9 | Tumble Dry | 8.8 |
| Line Dry | 4.8 | Tumble Dry | 4.7 |
| Line Dry | 5.2 | Tumble Dry | 5.3 |
Reference
Higgins, L., Anand, S.C., Holmes, D.A., Hall, M.E., and Underly, K. (2003). Effects of Various Home Laundering on the Dimensional Stability, Wrinkling, and Other Properties of Plain Woven Cotton Fabrics: Part II: Effect of Rinse Cycle Softener and Drying Method and of Tumble Sheet Softener and Tumble Drying Time. Textile Research Journal, 73, 407-420.

Graphs > Legacy Dialogs > Boxplot …


Scatter Plot
- Two dimensional graph to show the relationship among two variables
Example
An Experiment was conducted to test ballistic tests for some fabric. To test the effect, bullet volicity and depth of trauma was observed. Some obser vations as example are given in the following table. Each measurement is based on 6 replicates.
| Bullet Velocity | Trauma Depth |
|---|---|
| 372.83 | 3.87 |
| 370.67 | 5.20 |
| 370.50 | 4.85 |
| 369.33 | 7.12 |
| 371.67 | 2.73 |
| 370.50 | 5.75 |
| 369.67 | 5.32 |
Reference
Karahan, M. (2008). Comparison of Ballistic Performance and Energy Absorption Capabilities of Woven and Unidirectional Aramid Fabrics. Textile Research Journal, 78, 718-730.

Graphs > Legacy Dialogs > Scatter/Dot …


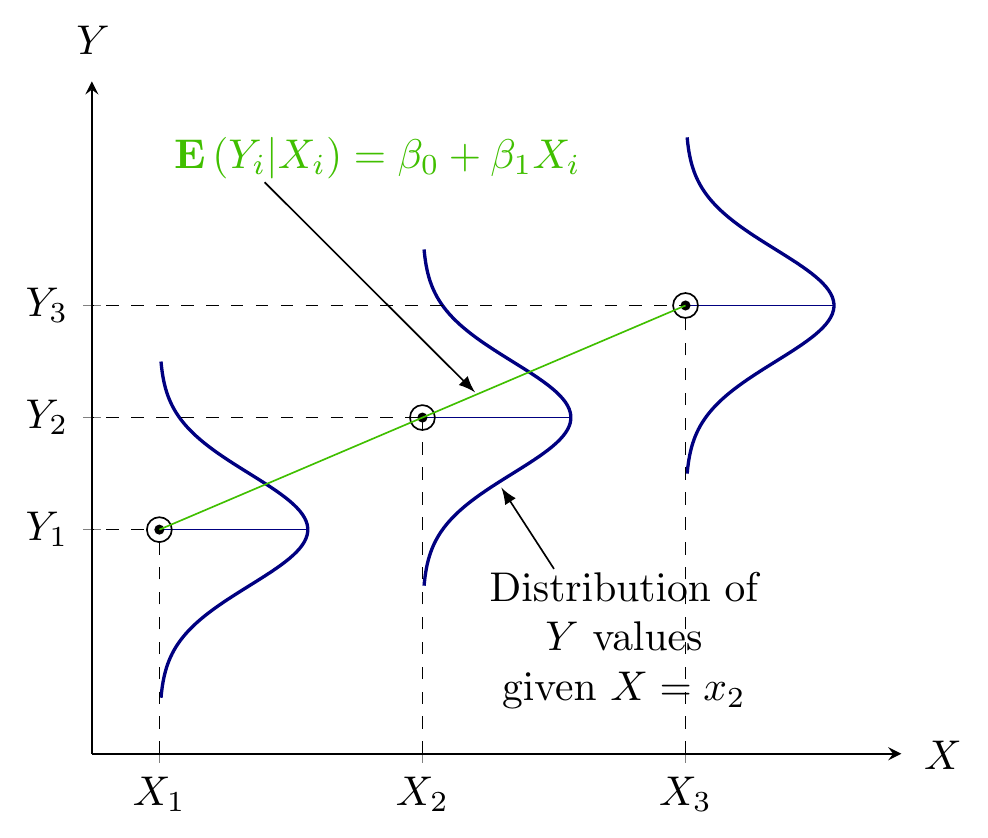
Regression Analysis
- Quantifying dependency of a normal response on quantitative explanatory variable(s)
alt text
Simple Linear Regression
- Quantifying dependency of a normal response on a quantitative explanatory variable
Example
An Experiment was conducted to test ballistic tests for some fabric. To test the effect, bullet volicity and depth of trauma was observed. Some obser vations as example are given in the following table. Each measurement is based on 6 replicates.
| Bullet Velocity | Trauma Depth |
|---|---|
| 372.83 | 3.87 |
| 370.67 | 5.20 |
| 370.50 | 4.85 |
| 369.33 | 7.12 |
| 371.67 | 2.73 |
| 370.50 | 5.75 |
| 369.67 | 5.32 |
Reference
Karahan, M. (2008). Comparison of Ballistic Performance and Energy Absorption Capabilities of Woven and Unidirectional Aramid Fabrics. Textile Research Journal, 78, 718-730.

Analyze > Regression > Linear …


Multiple Linear Regression
- Quantifying dependency of a normal response on two or more quantitative explanatory variables
Example
Following data presents a Factorial experiment relating yarn strength and elongation to 3 factors: Corn Starch, Nordux, and Fats. Conducted in Sudan Textile Factory Method.
| Corn Starch | Nordux | Fats | Single Strength | Enolgation |
|---|---|---|---|---|
| 85 | 50 | 30.25 | 419.7 | 3.22 |
| 140 | 50 | 30.25 | 442.7 | 2.78 |
| 85 | 100 | 30.25 | 457.4 | 1.60 |
| 140 | 100 | 30.25 | 435.2 | 1.88 |
| 85 | 50 | 30.00 | 404.1 | 1.88 |
| 140 | 50 | 30.00 | 479.1 | 2.34 |
| 85 | 100 | 30.00 | 450.8 | 2.44 |
| 140 | 100 | 30.00 | 432.7 | 2.12 |
| 85 | 50 | 30.25 | 378.1 | 2.88 |
| 140 | 50 | 30.25 | 413.3 | 2.37 |
| 85 | 100 | 30.25 | 365.1 | 1.40 |
| 140 | 100 | 30.25 | 492.0 | 2.02 |
| 85 | 50 | 30.00 | 389.5 | 2.02 |
| 140 | 50 | 30.00 | 467.8 | 1.92 |
| 85 | 100 | 30.00 | 442.3 | 2.44 |
| 140 | 100 | 30.00 | 444.3 | 1.74 |
Reference
Mousa, A.H.N. (1978). Analysis of the Effect of Size Formulation Variations on Yarn Tenacity and Elongation. Textile Research Journal, 48, 713-717.

Analyze > Regression > Linear …


Polynomial Regression Analysis
- Quantifying non-linear dependency of a normal response on quantitative explanatory variable(s)
Example
The Relationship Between Air Layers and Evaporative Resistance of Male Chinese Clothing is to be observed from Measurements of total air volume and total evaporative resistance of 39 Chinese clothing ensembles the following data.
| Air Volume | Evaporative Resistance | Air Volume | Evaporative Resistance |
|---|---|---|---|
| 22.99 | 13.7 | 32.29 | 21.2 |
| 27.98 | 16.8 | 33.60 | 21.1 |
| 24.41 | 16.5 | 34.83 | 21.0 |
| 33.21 | 17.3 | 36.37 | 22.9 |
| 42.07 | 18.5 | 38.52 | 21.2 |
| 44.30 | 19.0 | 30.02 | 19.3 |
| 46.00 | 18.0 | 50.18 | 23.4 |
| 93.06 | 23.2 | 32.70 | 20.5 |
| 26.19 | 18.8 | 33.57 | 20.2 |
| 30.76 | 17.5 | 64.02 | 24.4 |
| 28.76 | 19.4 | 60.16 | 23.2 |
| 30.30 | 21.2 | 35.85 | 22.3 |
| 49.43 | 20.5 | 39.89 | 22.7 |
| 28.06 | 20.1 | 47.83 | 24.3 |
| 33.61 | 21.2 | 30.60 | 18.1 |
| 28.93 | 19.5 | 35.19 | 23.0 |
| 20.07 | 18.5 | 45.72 | 23.6 |
| 84.67 | 21.1 | 74.20 | 26.6 |
| 27.95 | 20.2 | 65.07 | 30.2 |
| 31.07 | 22.4 |
Reference
Wang, F., Peng, H., and Shi, W. (2016). The Relationship Between Air Layers and Evaporative Resistance of Male Chinese Clothing. Applied Ergonomics, 56, 194-202.


Analyze > Regression > Curve Estimation …


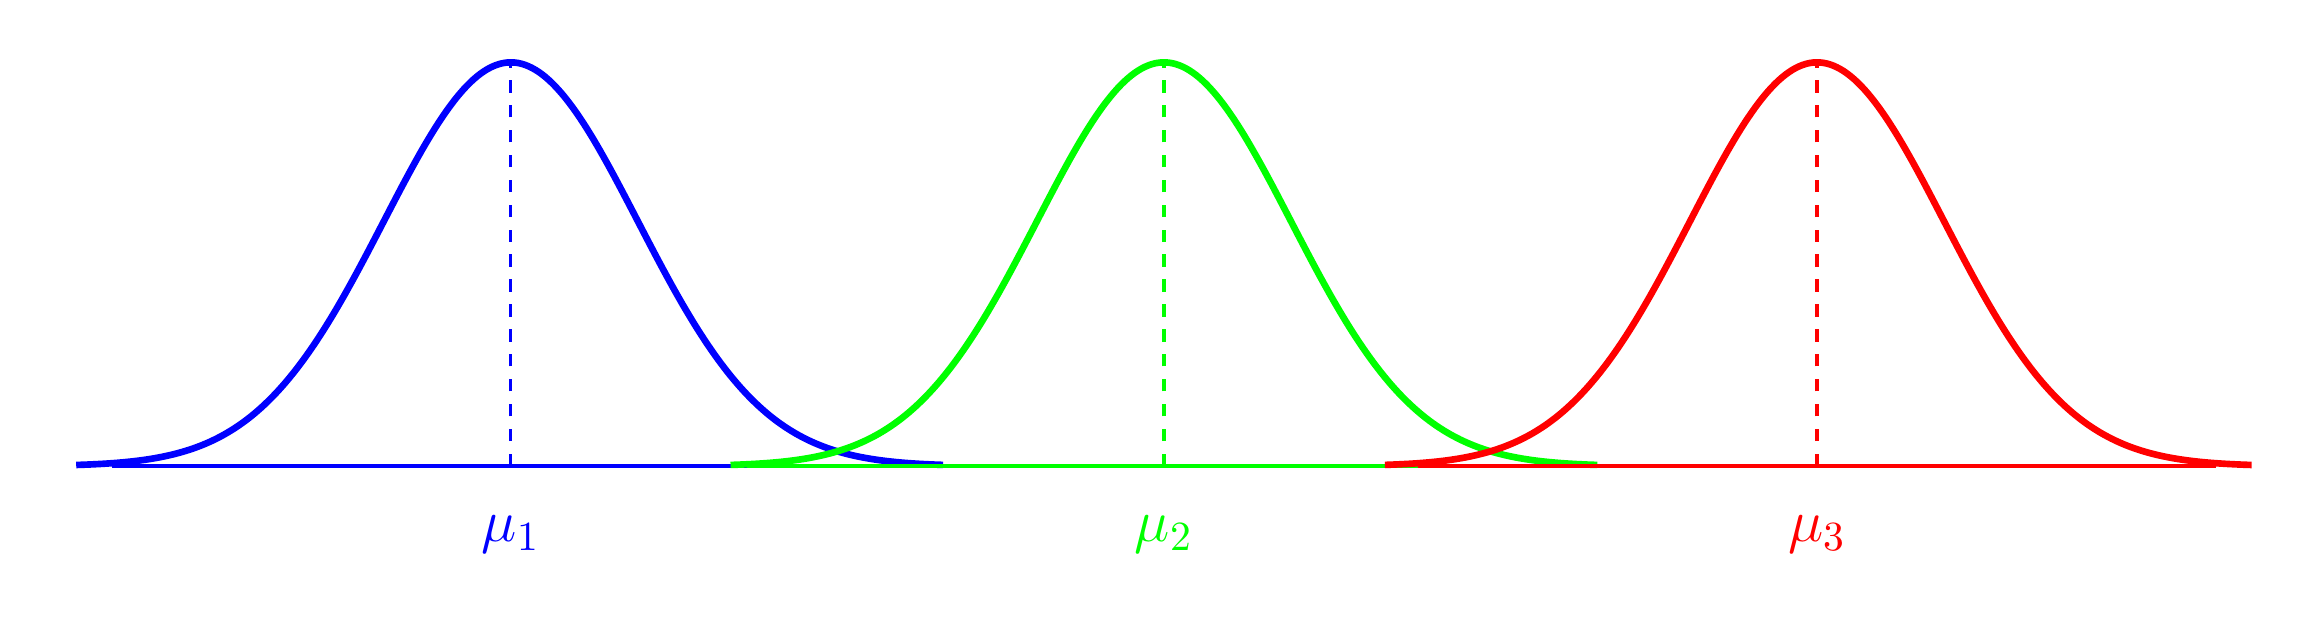
Analysis of Variance (ANOVA)
- Comparing means of Normal dependent variable for levels of different factor(s)
alt text
Example
Experiment comparing tensile strength and extension of blue jeans that were designed manually and with laser beams. Data from 20 pairs of jeans per design method is presented in the table.
| Method | Jean ID | Sample ID | Strength | Extension |
|---|---|---|---|---|
| 1 | 1 | 1 | 1266 | 68.06 |
| 1 | 2 | 1 | 1099 | 61.54 |
| 1 | 3 | 1 | 1068 | 40.48 |
| 1 | 4 | 1 | 1266 | 59.83 |
| 1 | 5 | 1 | 968 | 55.89 |
| 1 | 6 | 1 | 1039 | 54.12 |
| 1 | 7 | 1 | 1194 | 77.09 |
| 1 | 8 | 1 | 926 | 61.80 |
| 1 | 9 | 1 | 1009 | 58.31 |
| 1 | 10 | 1 | 1048 | 71.61 |
| 1 | 11 | 1 | 1203 | 74.40 |
| 1 | 12 | 1 | 884 | 63.38 |
| 1 | 13 | 1 | 1069 | 59.08 |
| 1 | 14 | 1 | 1034 | 73.21 |
| 1 | 15 | 1 | 1021 | 78.60 |
| 1 | 16 | 1 | 1022 | 57.44 |
| 1 | 17 | 1 | 1071 | 88.92 |
| 1 | 18 | 1 | 1089 | 76.77 |
| 1 | 19 | 1 | 1197 | 74.78 |
| 1 | 20 | 1 | 1035 | 71.11 |
| 2 | 21 | 1 | 1279 | 75.52 |
| 2 | 22 | 1 | 1197 | 71.44 |
| 2 | 23 | 1 | 1083 | 44.16 |
| 2 | 24 | 1 | 1418 | 70.56 |
| 2 | 25 | 1 | 1273 | 69.13 |
| 2 | 26 | 1 | 1232 | 62.52 |
| 2 | 27 | 1 | 1293 | 72.62 |
| 2 | 28 | 1 | 1121 | 68.96 |
| 2 | 29 | 1 | 1286 | 71.03 |
| 2 | 30 | 1 | 1416 | 69.34 |
| 2 | 31 | 1 | 1285 | 81.79 |
| 2 | 32 | 1 | 1268 | 69.29 |
| 2 | 33 | 1 | 1365 | 73.73 |
| 2 | 34 | 1 | 1309 | 75.01 |
| 2 | 35 | 1 | 1343 | 75.95 |
| 2 | 36 | 1 | 1292 | 72.64 |
| 2 | 37 | 1 | 1234 | 73.73 |
| 2 | 38 | 1 | 1226 | 75.97 |
| 2 | 39 | 1 | 1229 | 71.60 |
| 2 | 40 | 1 | 1254 | 70.48 |
| 1 | 1 | 2 | 1140 | 63.04 |
| 1 | 2 | 2 | 1104 | 65.20 |
| 1 | 3 | 2 | 1051 | 50.62 |
| 1 | 4 | 2 | 1128 | 56.21 |
| 1 | 5 | 2 | 1044 | 53.51 |
| 1 | 6 | 2 | 1303 | 59.53 |
| 1 | 7 | 2 | 1081 | 60.75 |
| 1 | 8 | 2 | 958 | 60.60 |
| 1 | 9 | 2 | 1058 | 69.80 |
| 1 | 10 | 2 | 1077 | 62.05 |
| 1 | 11 | 2 | 956 | 72.87 |
| 1 | 12 | 2 | 1010 | 59.41 |
| 1 | 13 | 2 | 1062 | 61.71 |
| 1 | 14 | 2 | 1073 | 71.51 |
| 1 | 15 | 2 | 1027 | 68.16 |
| 1 | 16 | 2 | 1048 | 60.76 |
| 1 | 17 | 2 | 1101 | 63.70 |
| 1 | 18 | 2 | 1076 | 80.69 |
| 1 | 19 | 2 | 1081 | 69.65 |
| 1 | 20 | 2 | 1084 | 68.45 |
| 2 | 21 | 2 | 1205 | 71.44 |
| 2 | 22 | 2 | 1214 | 69.00 |
| 2 | 23 | 2 | 1055 | 47.05 |
| 2 | 24 | 2 | 1402 | 74.50 |
| 2 | 25 | 2 | 1310 | 72.76 |
| 2 | 26 | 2 | 1324 | 73.01 |
| 2 | 27 | 2 | 1303 | 79.82 |
| 2 | 28 | 2 | 1083 | 65.43 |
| 2 | 29 | 2 | 1391 | 69.84 |
| 2 | 30 | 2 | 1225 | 74.16 |
| 2 | 31 | 2 | 1396 | 79.49 |
| 2 | 32 | 2 | 1273 | 75.30 |
| 2 | 33 | 2 | 1326 | 66.65 |
| 2 | 34 | 2 | 1393 | 79.21 |
| 2 | 35 | 2 | 1172 | 73.57 |
| 2 | 36 | 2 | 1241 | 71.80 |
| 2 | 37 | 2 | 1292 | 77.70 |
| 2 | 38 | 2 | 1354 | 73.83 |
| 2 | 39 | 2 | 1299 | 73.59 |
| 2 | 40 | 2 | 1202 | 68.45 |
| 1 | 1 | 3 | 1104 | 61.40 |
| 1 | 2 | 3 | 1113 | 63.44 |
| 1 | 3 | 3 | 1063 | 50.48 |
| 1 | 4 | 3 | 1200 | 63.08 |
| 1 | 5 | 3 | 1006 | 66.70 |
| 1 | 6 | 3 | 860 | 46.39 |
| 1 | 7 | 3 | 936 | 62.76 |
| 1 | 8 | 3 | 967 | 64.72 |
| 1 | 9 | 3 | 1018 | 61.55 |
| 1 | 10 | 3 | 1191 | 69.50 |
| 1 | 11 | 3 | 987 | 73.45 |
| 1 | 12 | 3 | 1155 | 79.59 |
| 1 | 13 | 3 | 982 | 57.91 |
| 1 | 14 | 3 | 1064 | 70.86 |
| 1 | 15 | 3 | 1112 | 68.17 |
| 1 | 16 | 3 | 1040 | 63.46 |
| 1 | 17 | 3 | 1075 | 61.44 |
| 1 | 18 | 3 | 1081 | 73.51 |
| 1 | 19 | 3 | 1045 | 71.19 |
| 1 | 20 | 3 | 1077 | 69.33 |
| 2 | 21 | 3 | 1283 | 78.62 |
| 2 | 22 | 3 | 1154 | 63.06 |
| 2 | 23 | 3 | 1117 | 42.43 |
| 2 | 24 | 3 | 1335 | 71.45 |
| 2 | 25 | 3 | 1277 | 73.41 |
| 2 | 26 | 3 | 1313 | 71.44 |
| 2 | 27 | 3 | 1361 | 74.27 |
| 2 | 28 | 3 | 1104 | 70.42 |
| 2 | 29 | 3 | 1450 | 72.40 |
| 2 | 30 | 3 | 1323 | 75.00 |
| 2 | 31 | 3 | 1315 | 74.82 |
| 2 | 32 | 3 | 1321 | 77.76 |
| 2 | 33 | 3 | 1315 | 66.90 |
| 2 | 34 | 3 | 1386 | 77.64 |
| 2 | 35 | 3 | 1165 | 75.60 |
| 2 | 36 | 3 | 1198 | 69.73 |
| 2 | 37 | 3 | 1223 | 69.42 |
| 2 | 38 | 3 | 1289 | 80.39 |
| 2 | 39 | 3 | 1339 | 71.40 |
| 2 | 40 | 3 | 1266 | 72.36 |
Reference
Ondogan, Z., Pamuk, O., Ondogan, E.N., and Ozguney, A. (2005). Improving the Appearance of All Textile Products from Clothing to Home Textile Using Laser Technology. Optics and Laser Technology, 37, 631-637.

Analyze > General Linear Model > Univariate …


Example
The analysis of variance of cotton yarn fineness is customer satisfaction with quality textile product. The purpose of this study is to minimize the faults of finished cotton fabric by maintaining actual yarn count during producing in ring frame. If the analysis shows the mean count difference due to shift and machine number then action should be taken to maintain required count of yarn. This action may be taken by setting of actual draft, uniform linear density of finisher draw frame sliver and maintaining proper atmospheric condition in ring and back section. The 210 data for yarn count of 30 KH (30 carded Hosiery) was summarized as follows:
| Machine Number | Shift | YarnCount |
|---|---|---|
| 1 | A | 29.52 |
| 2 | A | 29.58 |
| 3 | A | 28.62 |
| 4 | A | 30.50 |
| 5 | A | 29.03 |
| 6 | A | 29.75 |
| 7 | A | 31.28 |
| 1 | B | 30.91 |
| 2 | B | 29.33 |
| 3 | B | 29.32 |
| 4 | B | 30.04 |
| 5 | B | 30.33 |
| 6 | B | 30.91 |
| 7 | B | 29.95 |
| 1 | C | 30.14 |
| 2 | C | 30.00 |
| 3 | C | 29.98 |
| 4 | C | 28.99 |
| 5 | C | 29.82 |
| 6 | C | 29.85 |
| 7 | C | 30.05 |
Reference
Hossen, J., Haque, E., Khan, S.K., and Saha, S. (2012). Analysis of cotton yarn count variation by two way ANOVA. Conference: Annals of the University of Oradea, Fascicle of Textiles, Leatherwork. At Annals of the University of Oradea, XIII-02.

Analyze > General Linear Model > Univariate …


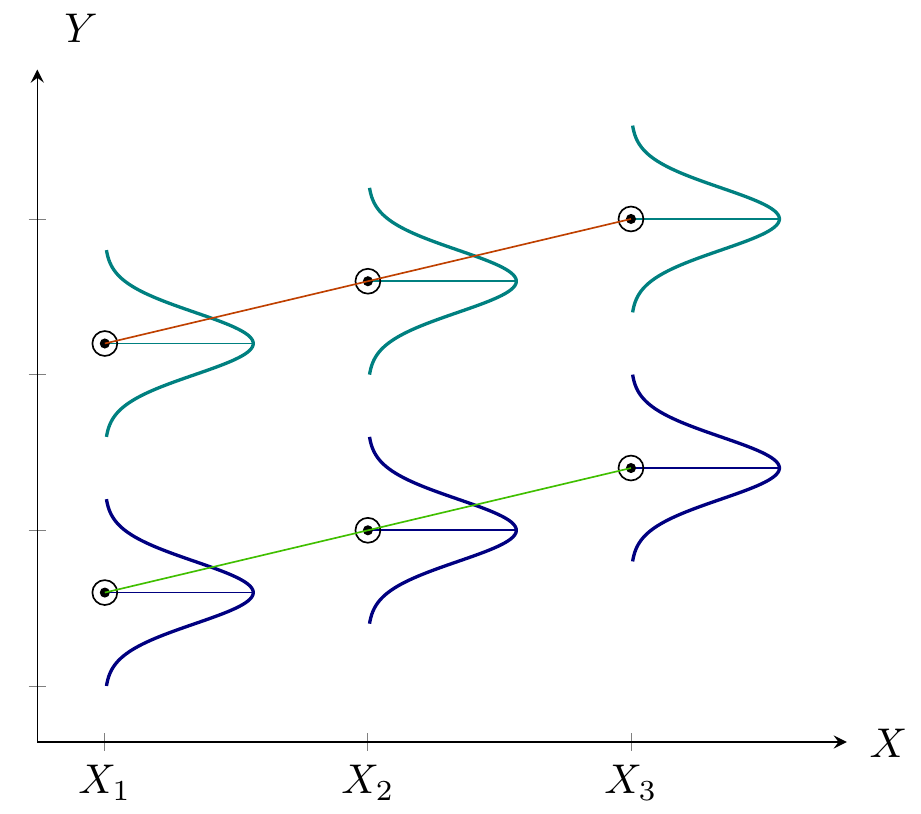
Analysis of Covariance (ANCOVA)
- Quantifying dependency of a normal response on quantitative explanatory variable(s)
- Comparing means of Normal dependent variable for levels of different factor(s)
alt text
Example
Results of Experiment measuring top shrinkage under 3 treatments (untreated, ether-extracted, ether/alcohol extracted), measured at 3 levels of pH (2, 6, 10) is given in the following table.
| Treatment | pH | Shrinkage |
|---|---|---|
| Untreated | 2 | 42.8 |
| Untreated | 6 | 46.2 |
| Untreated | 10 | 45.6 |
| Untreated | 2 | 43.0 |
| Untreated | 6 | 47.0 |
| Untreated | 10 | 43.8 |
| Untreated | 2 | 43.5 |
| Untreated | 6 | 45.2 |
| Untreated | 10 | 45.7 |
| Ether Extract | 2 | 33.6 |
| Ether Extract | 6 | 40.4 |
| Ether Extract | 10 | 40.1 |
| Ether Extract | 2 | 35.0 |
| Ether Extract | 6 | 39.4 |
| Ether Extract | 10 | 39.5 |
| Ether Extract | 2 | 36.2 |
| Ether Extract | 6 | 37.9 |
| Ether Extract | 10 | 39.2 |
| ether/alcohol extracted | 2 | 35.6 |
| ether/alcohol extracted | 6 | 35.2 |
| ether/alcohol extracted | 10 | 36.6 |
| ether/alcohol extracted | 2 | 34.8 |
| ether/alcohol extracted | 6 | 33.0 |
| ether/alcohol extracted | 10 | 32.3 |
| ether/alcohol extracted | 2 | 34.8 |
| ether/alcohol extracted | 6 | 32.3 |
| ether/alcohol extracted | 10 | 35.6 |
Reference
Lindberg, J. (1953). Relationship Between Various Surface Properties of Wool Fibers: Part II: Frictional Properties. Textile Research Journal, 23, 225-237.

Same Slopes but different Intercepts
Analyze > General Linear Model > Univariate …


Different Intercepts and different Slopes
Analyze > General Linear Model > Univariate …


Factorial Experiments
- Treatments are the combinations of the levels of different factors
Example
Following data presents the number of warp breaks per loom, where a loom corresponds to a fixed length of yarn for two factors, Wool Type with Two levels (A,B) and Tension with three levels.(Low, Medium, High). Analyze the data with interaction.
| WoolType | Tension | Yarn Breaks |
|---|---|---|
| A | L | 26 |
| A | L | 30 |
| A | L | 54 |
| A | L | 25 |
| A | L | 70 |
| A | L | 52 |
| A | L | 51 |
| A | L | 26 |
| A | L | 67 |
| A | M | 18 |
| A | M | 21 |
| A | M | 29 |
| A | M | 17 |
| A | M | 12 |
| A | M | 18 |
| A | M | 35 |
| A | M | 30 |
| A | M | 36 |
| A | H | 36 |
| A | H | 21 |
| A | H | 24 |
| A | H | 18 |
| A | H | 10 |
| A | H | 43 |
| A | H | 28 |
| A | H | 15 |
| A | H | 26 |
| B | L | 27 |
| B | L | 14 |
| B | L | 29 |
| B | L | 19 |
| B | L | 29 |
| B | L | 31 |
| B | L | 41 |
| B | L | 20 |
| B | L | 44 |
| B | M | 42 |
| B | M | 26 |
| B | M | 19 |
| B | M | 16 |
| B | M | 39 |
| B | M | 28 |
| B | M | 21 |
| B | M | 39 |
| B | M | 29 |
| B | H | 20 |
| B | H | 21 |
| B | H | 24 |
| B | H | 17 |
| B | H | 13 |
| B | H | 15 |
| B | H | 15 |
| B | H | 16 |
| B | H | 28 |
Reference
Tippett, L. H. C. (1950). Technological Applications of Statistics. John Wiley & Sons, New York, USA.

Analyze > General Linear Model > Univariate …


